监控相关
ZABBIX安装与使用
自动发现与自动注册
配置文件
分布式监控
zabbix_sender安装和使用
zabbix_get安装与使用
自定义监控
自动发现监控json
PERCONA插件
PERCONA多实例
日志监控
相关项目监控
监控MySQL
监控Haproxy
Fluentd日志监控
Grafana(可视化监控指标)
grafana地图插件
添加prometheus模板
开启HTTPS
添加zabbix插件
Grafana模板
正则表达式
Prometheus监控
安装与使用
Prometheus存储
服务发现
Prometheus标签
PromQL查询
PushGateway推送组件
AlertManager告警组件
告警规则rule
K8S监控(kube-state-metric/cadvisor)
探针监控(blackbox_exporter)
Node_export
Mysql_export
Redis-exporter
cloudeye-exporter【华为云监控】
RabbitMQ-exporter
K8S监控
本文档使用MrDoc发布
返回首页
-
+
PushGateway推送组件
2021年6月17日 11:44
admin
#下载主页 https://prometheus.io/download/ #安装PushGateway wget https://github.com/prometheus/pushgateway/releases/download/v1.4.1/pushgateway-1.4.1.linux-amd64.tar.gz tar -zxvf pushgateway-1.4.1.linux-amd64.tar.gz mv pushgateway-1.4.1.linux-amd64 /usr/local/pushgateway cd /usr/local/pushgateway ./pushgateway --version #启动PushGateway cd /usr/local/pushgateway ./pushgateway #前台启动 nohup ./pushgateway & #后台启动 ----------------------------------------------------------- --web.listen-address=":9091" #pushgateway监听的端口,默认是9091,若需要修改则通过此参数。 --web.telemetry-path="/metrics" #获取metric信息的url,默认是/metrics,若需要修改则通过此参数 --log.level="info" #设置日志级别 --log.format="logger:stderr" #设置打印日志的格式,若有自动化日志提取工具可以使用这个参数规范日志打印的格式 #查看 http://【PushGateway服务器IP】:9091/ 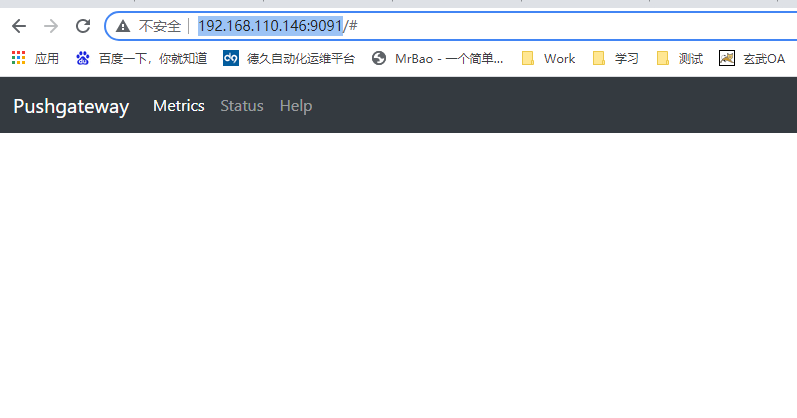 --- #在prometheus中添加pushgateway ####修改prometheus的配置文件 vim prometheus.yml #内容 - job_name: 'push-metrics' static_configs: - targets: ['192.168.110.146:9091'] honor_labels: true ####注意:因为prometheus配置pushgateway 的时候,也会指定job和instance,但是它只表示pushgateway实例,不能真正表达收集数据的含义。所以配置pushgateway需要添加honor_labels:true,避免收集数据本身的job和instance被覆盖 --- #添加数据 ####格式:http://IP:PORT/metrics/job/[jobname]/instance/[instancename] #单条数据 echo "some_metric 3.14" | curl --data-binary @- http://192.168.110.146:9091/metrics/job/some_job ----------------------------------------------------------- #多条数据 cat <<EOF | curl --data-binary @- http://192.168.110.146:9091/metrics/job/some_job/instance/some_instance # TYPE some_metric counter some_metric{label="val1"} 42 # TYPE another_metric gauge # HELP another_metric Just an example. another_metric 2398.283 EOF ----------------------------------------------------------- #文件方式导入 vim data.txt #内容: http_request_total{code="200",domain="abc.cn"} 276683 http_request_total{code="400",domain="abc.cn"} 0 http_request_total{code="408",domain="abc.cn"} 7 #发送: curl -X POST --data-binary @data.txt http://192.168.110.146:9091/metrics/job/some_job/instance/some_instance --- #删除数据 curl -X DELETE http://192.168.110.146:9091/metrics/job/some_job
分享到: