监控相关
ZABBIX安装与使用
自动发现与自动注册
配置文件
分布式监控
zabbix_sender安装和使用
zabbix_get安装与使用
自定义监控
自动发现监控json
PERCONA插件
PERCONA多实例
日志监控
相关项目监控
监控MySQL
监控Haproxy
Fluentd日志监控
Grafana(可视化监控指标)
grafana地图插件
添加prometheus模板
开启HTTPS
添加zabbix插件
Grafana模板
正则表达式
Prometheus监控
安装与使用
Prometheus存储
服务发现
Prometheus标签
PromQL查询
PushGateway推送组件
AlertManager告警组件
告警规则rule
K8S监控(kube-state-metric/cadvisor)
探针监控(blackbox_exporter)
Node_export
Mysql_export
Redis-exporter
cloudeye-exporter【华为云监控】
RabbitMQ-exporter
K8S监控
本文档使用MrDoc发布
返回首页
-
+
Grafana模板
2023年5月11日 10:24
admin
#官网 https://grafana.com/grafana/dashboards/?plcmt=footer --- #K8S整体模板(13105) 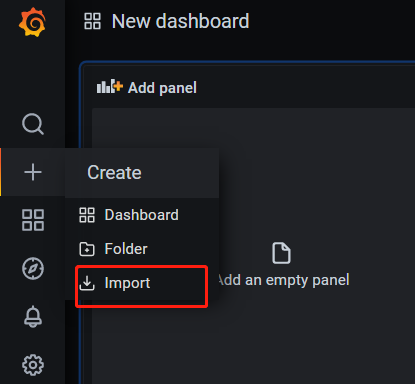 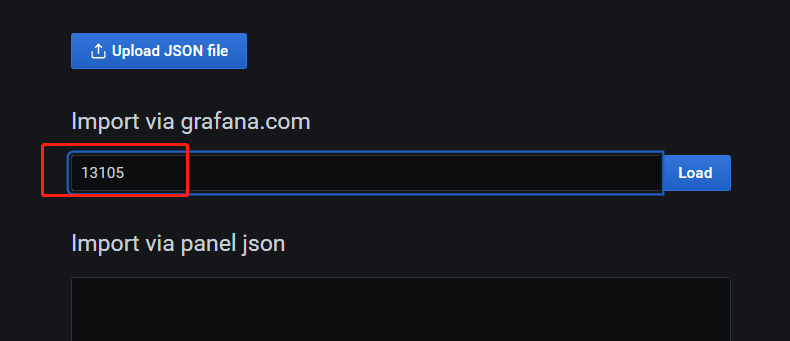 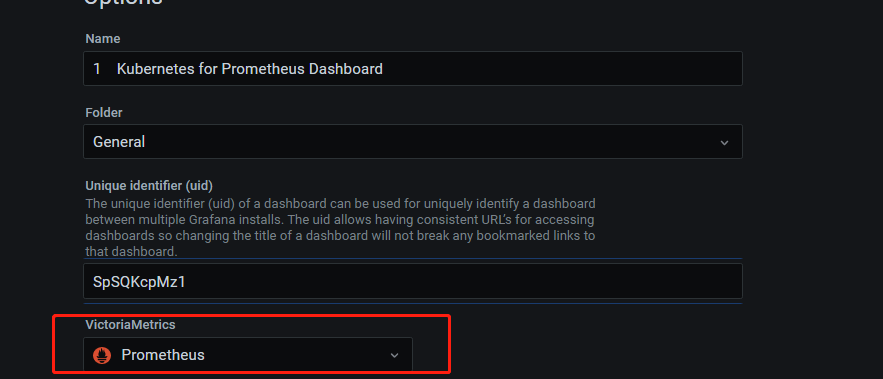 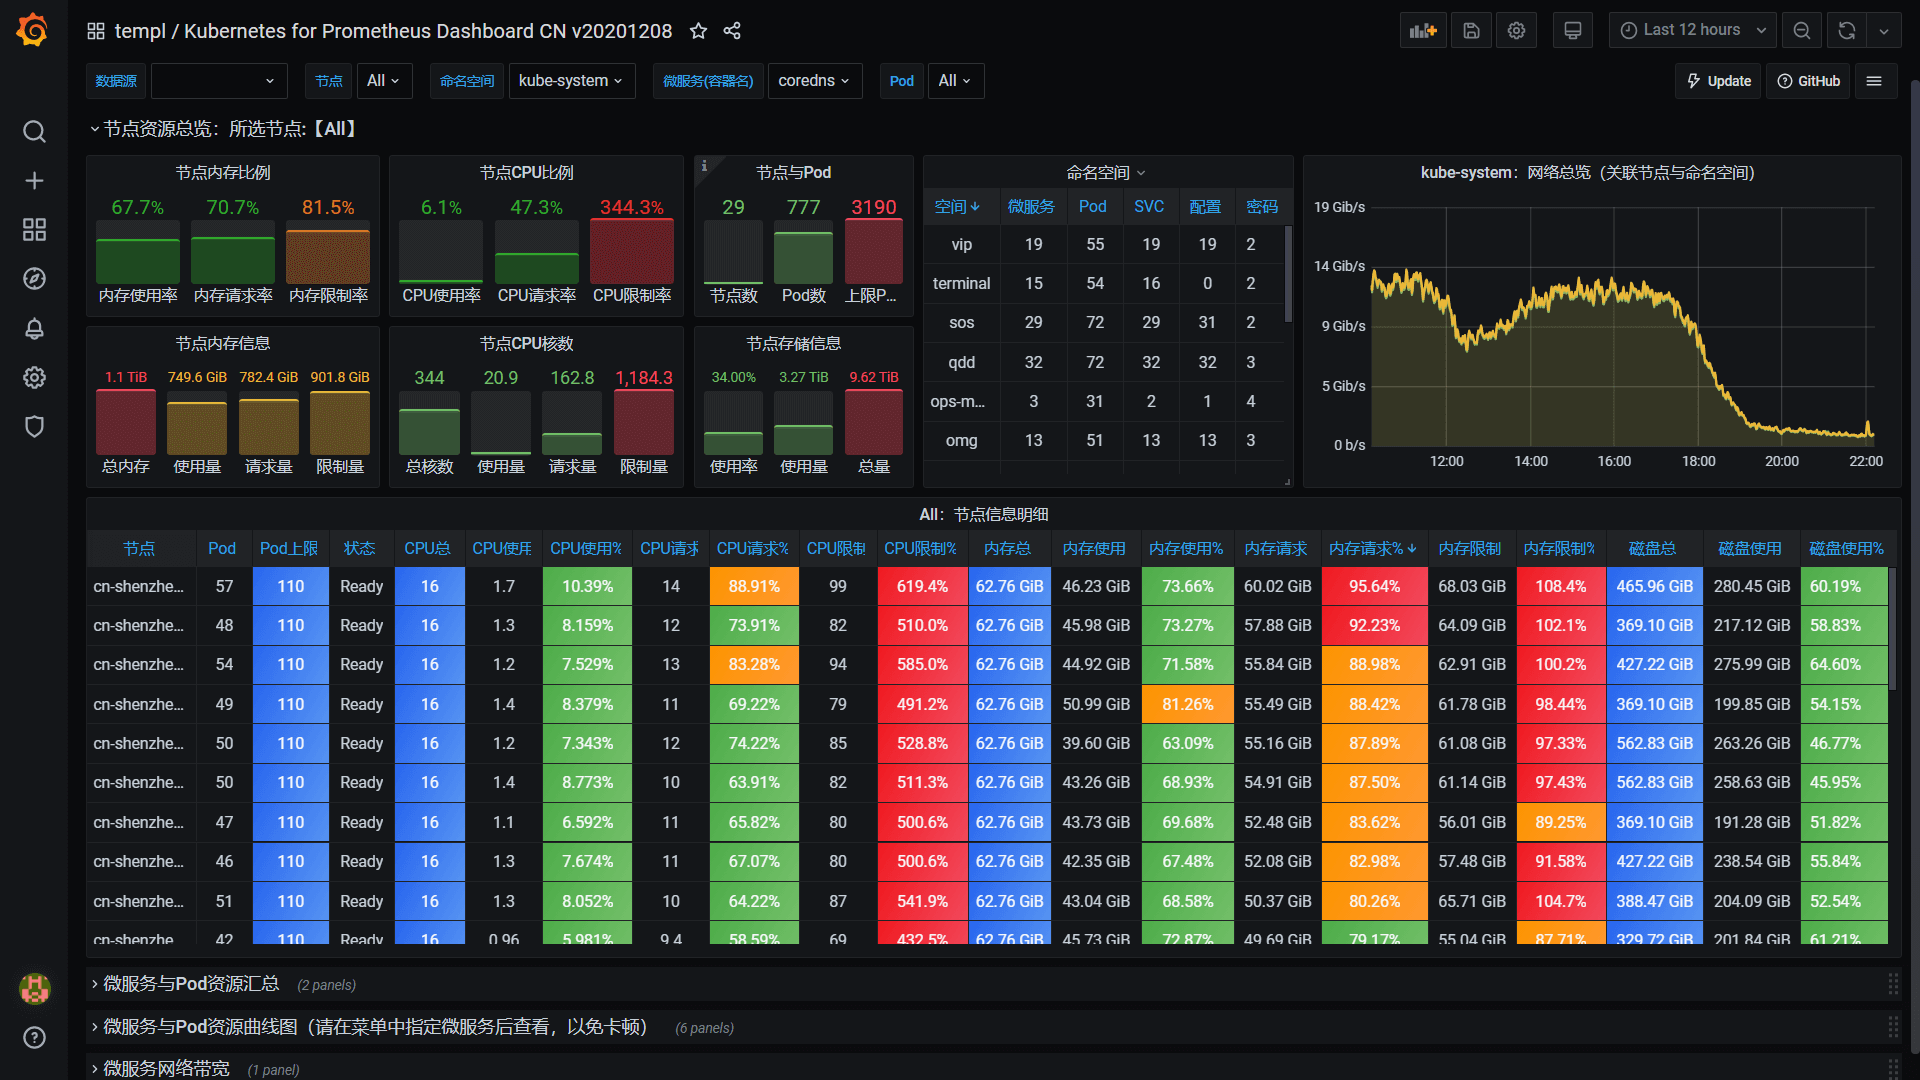 --- #node_export模板(8919) 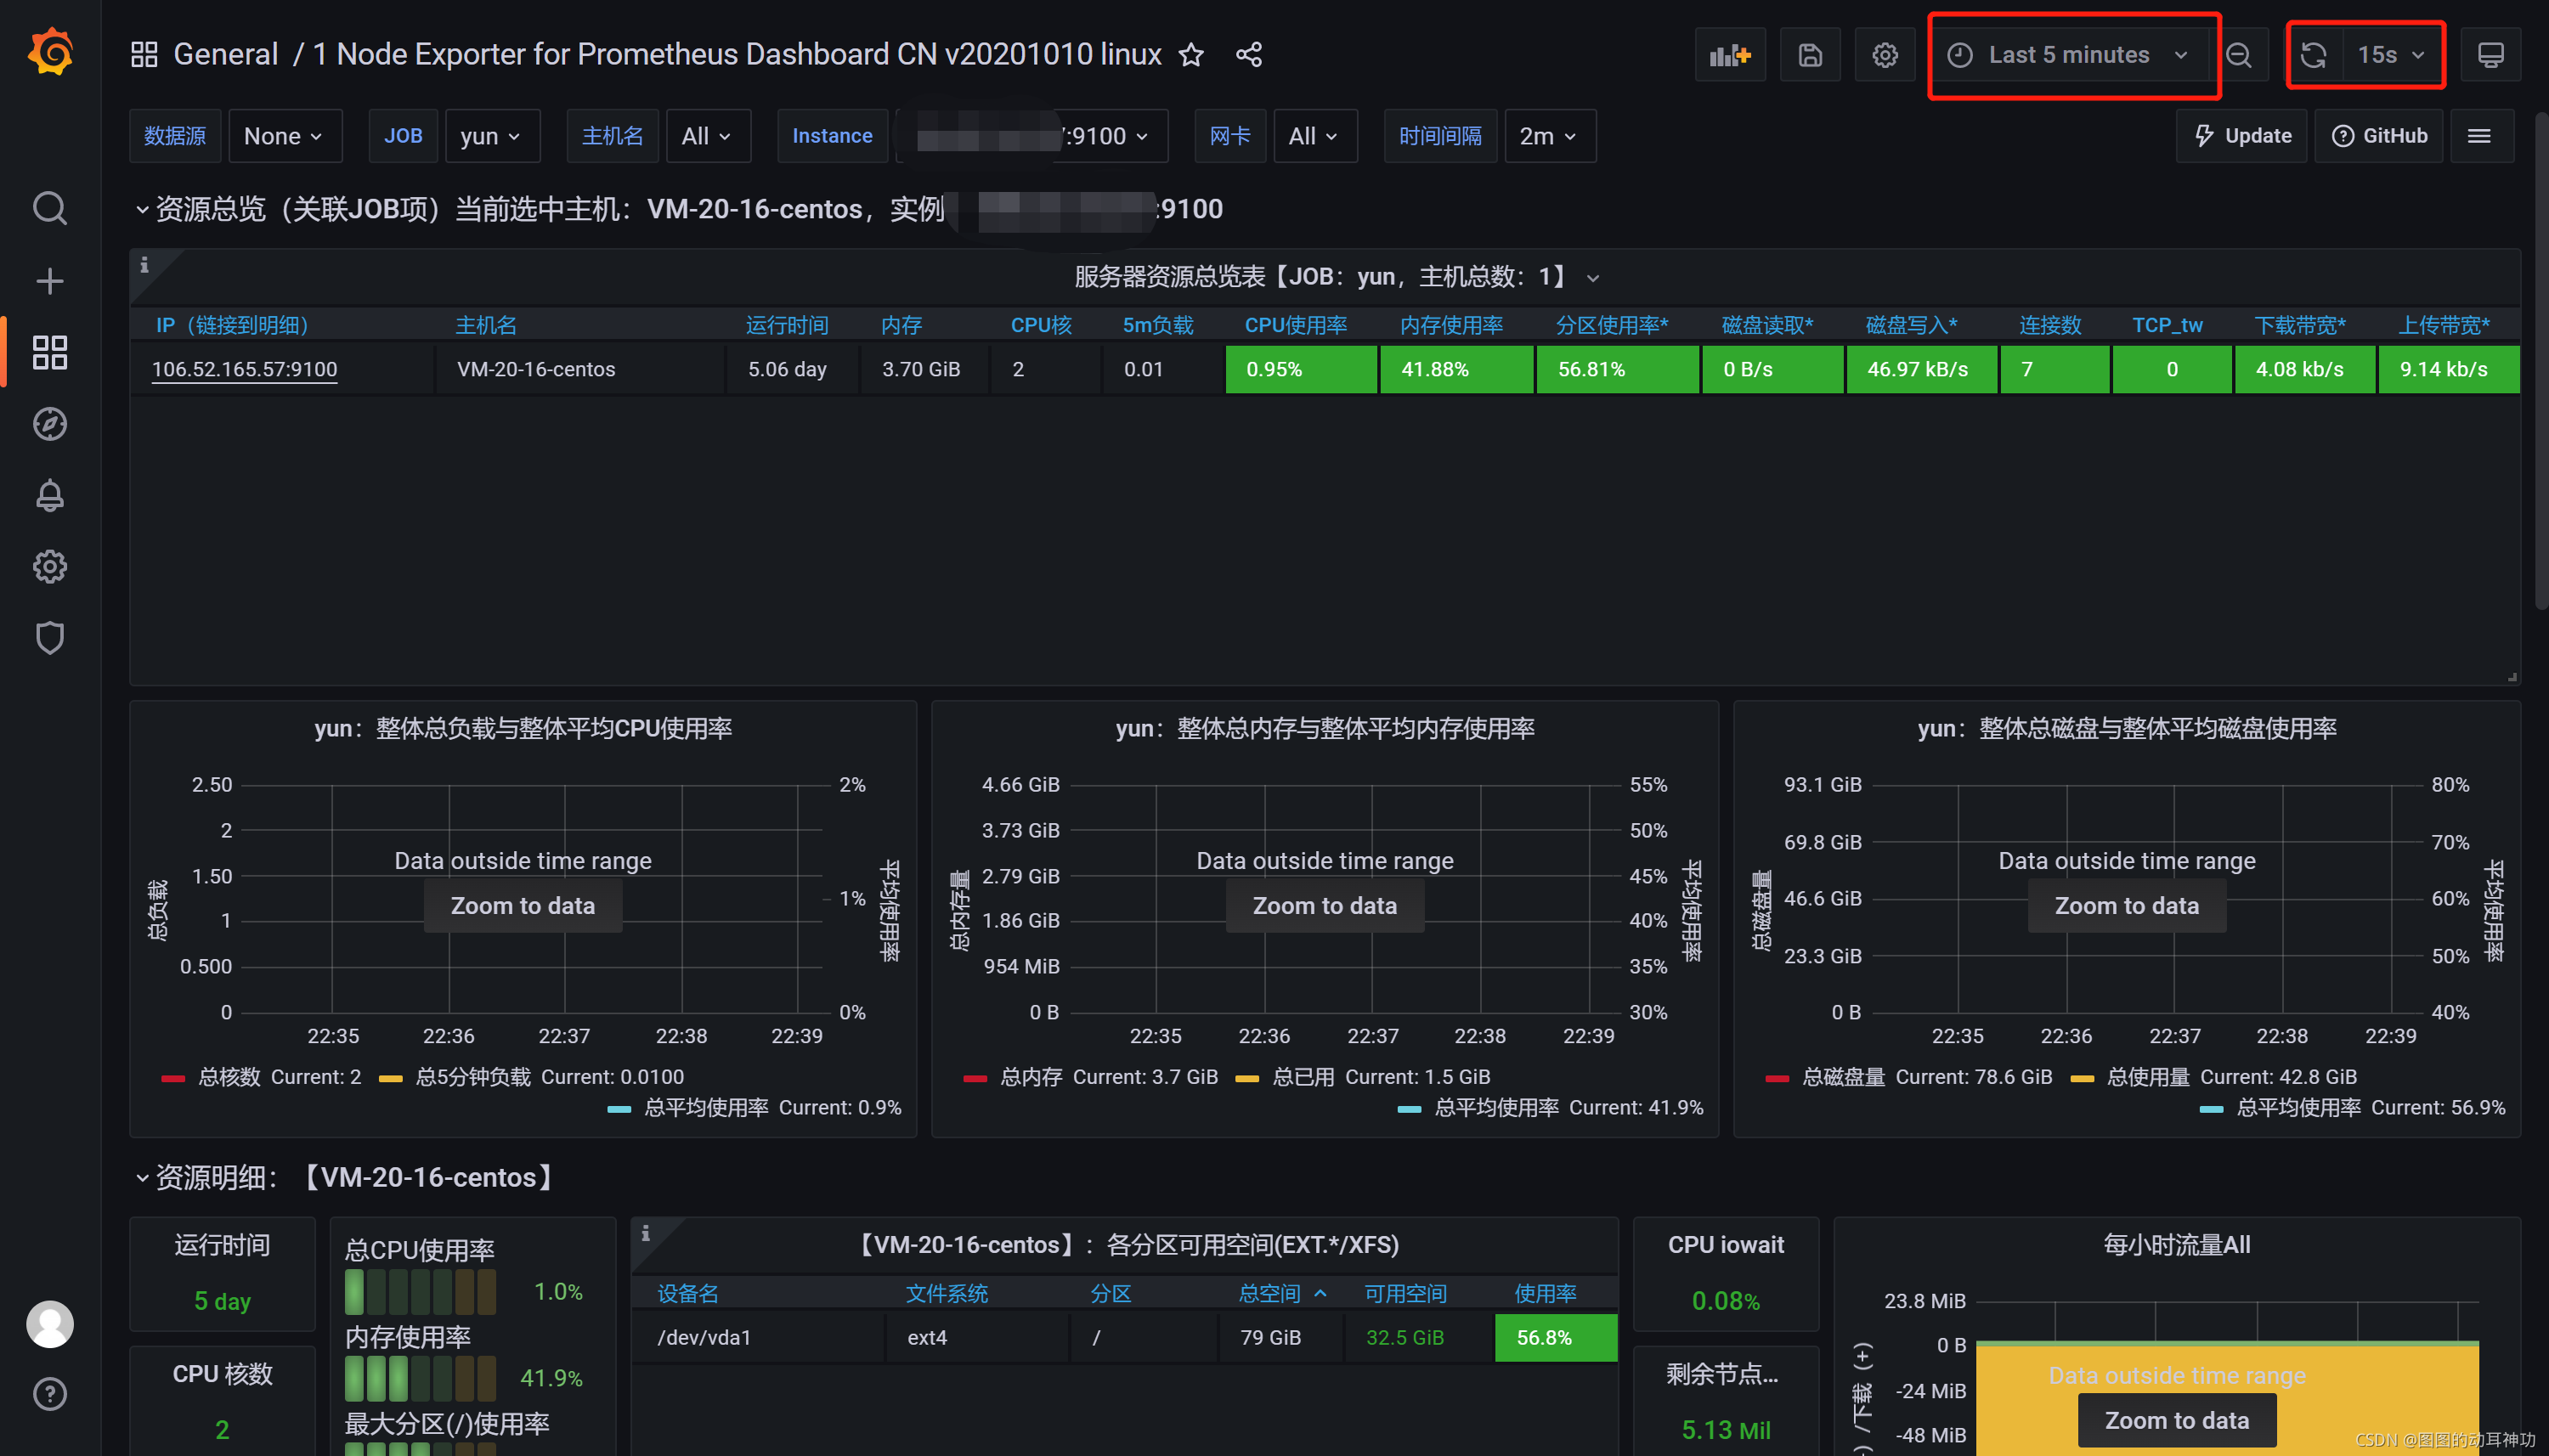
分享到: